
Australian Workplace Safety Statistics: What the 2025 Data Tells Us
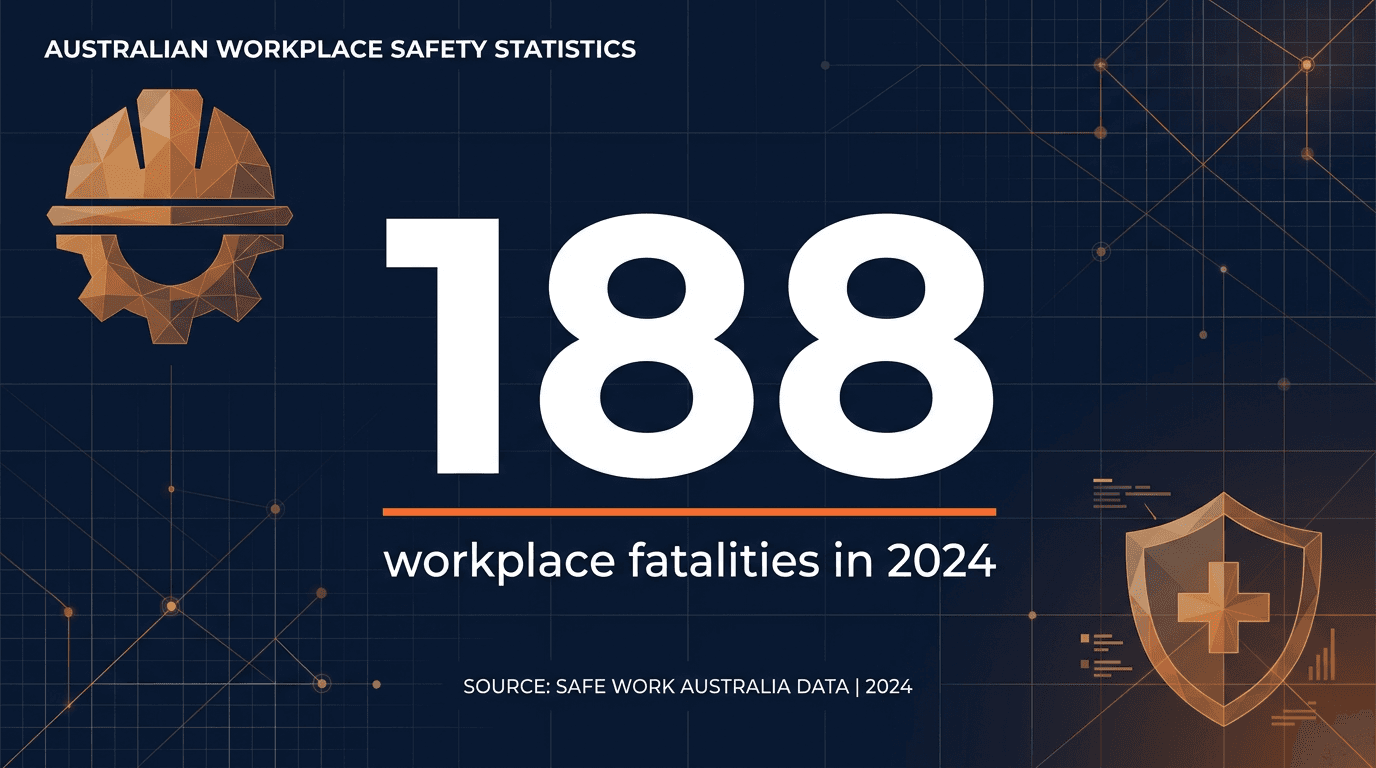
188 worker fatalities in 2024; mental health claims up 161% in a decade. Updated Safe Work Australia 2025 statistics — fatality rates, construction risk, and compliance priorities.
In 2024, 188 Australian workers lost their lives to traumatic workplace injuries — a fatality rate of 1.3 per 100,000 workers, below the five-year average of 1.4 but representing a person who did not come home every 1.9 days on average. Safe Work Australia published the full Key Work Health and Safety Statistics Australia 2025 report during National Safe Work Month 2025.
Key findings from Safe Work Australia (2025 release)
Who is most at risk? 96% of fatalities were male. Machinery operators and drivers accounted for 32% of all deaths — a rate 5× the national average at 6.7 per 100,000 workers.
The deadliest industries. Six industries accounted for 80% of traumatic injury fatalities: agriculture, forestry and fishing (13.7 per 100,000 — highest rate), public administration and safety, transport/postal/warehousing, manufacturing, health care and social assistance, and construction (37 fatalities, ~20% of total).
Leading causes. Vehicle incidents caused 42% of fatal injuries. Falls from height followed at 13% — a persistent risk in construction, signage, and facilities maintenance. 84% of serious claims involved body stressing, falls/slips/trips, being hit by moving objects, or mental stress.
Serious injury claims
There were 146,700 serious workers' compensation claims in 2023–24, each involving at least one week of work loss. Workers aged 55–64 and 65+ had the highest claim frequency rates (9.5 and 10.0 per million hours worked).
Mental health: the fastest-growing category
Mental health conditions represent 12% of all serious claims — up 14.7% from 2022–23 and 161% over the past decade. Median time lost for mental health claims is nearly five times longer than physical injuries. Psychosocial hazards are now enforceable under model WHS law — see our psychosocial hazards guide.
What this means for construction compliance in 2026
Regulators use this data to prioritise inspections — falls, silica, mobile plant and psychosocial hazards on construction sites. For PCBUs:
Teams using AxionSite connect SWMS, sign-ons, hazard reports and Intelligence Centre metrics so safety managers spend time on controls — not reconciling folders before an audit.
Sources: Safe Work Australia, Key Work Health and Safety Statistics Australia 2025; Safe Work Australia interactive data dashboards (data.safeworkaustralia.gov.au).
Ready to automate your WHS compliance?
Watch the short walkthrough on our AxionSite product page—the same flow from site details through SWMS generation, sign-off, PDF export, and crew sign-on—then start your trial when you’re ready.